I've had a lot going on this week, including seeing an excellent production of Elektra at Lyric Opera of Chicago last night, so I haven't had time to read all of these articles:
And I shall begin reading these...soon. Maybe tomorrow. Sigh.
The University of Illinois at Chicago (UIC) has published a study of Chicago income by census tract, and has found a disturbing trend:
Chicago’s middle class, once the backbone of the city, is declining so swiftly that it’s almost gone, and a set of maps from a local university lays that reality bare.
The dynamic stands to affect nearly everything about Chicago going forward, from politics to schools to who will live here.
“It raises a lot of questions as to what kind of city it will be,” said Janet Smith, co-director of the Nathalie P. Voorhees Center for Neighborhood and Community Improvement at the University of Illinois at Chicago, which compiled the maps that document Chicago’s shrinking middle class — and an increasingly polarized city — over the past five decades.
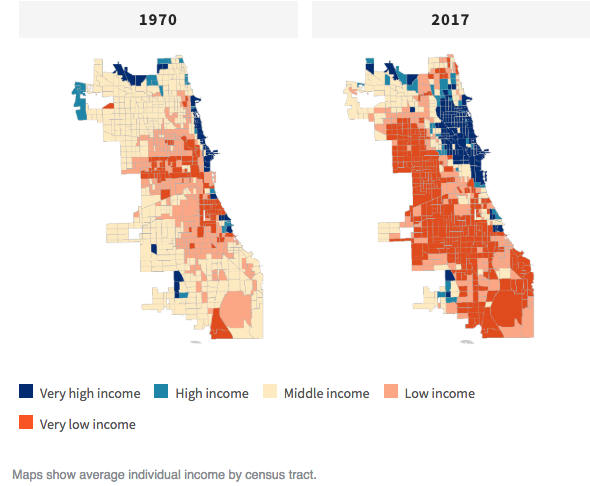
UIC’s maps show that fully half of the city was middle income in 1970, including large swaths on every side of town. Today, just 16 percent of the city’s 797 census tracts are considered middle income. Those middle income areas are confined mostly to the corners of the city, and to thin strips between areas of wealth and poverty.
Lutton goes on to examine the economic, cultural, and other trends that are driving this change.
Paul Krugman says the president actually doesn't want to:
Why isn’t Trump building anything? Surely he’s exactly the kind of politician likely to suffer from an edifice complex, a desire to see his name on big projects. Furthermore, during the 2016 campaign he didn’t just promise a wall, he also promised a major rebuilding of America’s infrastructure.
But month after month of inaction followed his inauguration. A year ago he again promised “the biggest and boldest infrastructure investment in American history.” Again, nothing happened.
In short, money isn’t why we aren’t building infrastructure. The real obstacle is that Trump, his officials, his party or all of the above don’t actually want the kind of public investment America needs. Build they won’t.
In the case of Trump administration officials, what’s striking about the various infrastructure “plans” they’ve offered — they’re more like vague sketches — is that they involve very little direct public investment. Instead, they’re schemes that would purportedly use public funds as a sweetener to induce large amounts of private investment. Why not just build stuff? Partly, perhaps, to hold down the headline cost. But such schemes would also amount to a backdoor way to privatize public assets, while possibly generating little new investment.
And while a real infrastructure plan would gain a lot of support from Democrats, an exercise in crony capitalism pretending to be about infrastructure wouldn’t.
To sum up: The Republican Party wants to rule, not to govern; and infrastructure benefits no one they care about.
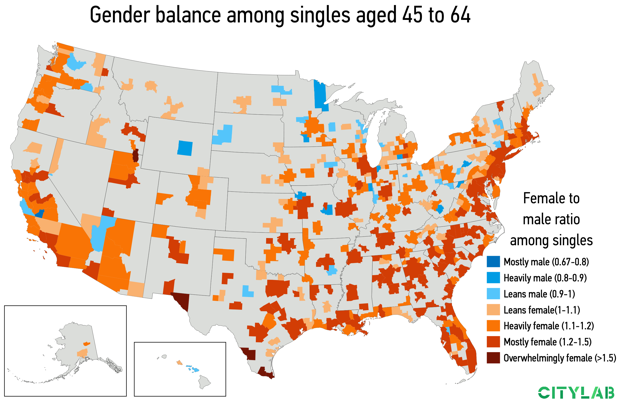
Demographers Richard Florida and Karen King crunched some numbers to determine which metro areas had more single men or single women. Some findings:
In absolute numbers, heterosexual men have a considerable dating advantage in metros across the East Coast and South. New York City has more than 200,000 more single women than men; Atlanta 95,000 more; Washington, D.C. 63,000 more; Philadelphia nearly 60,000 more. The pattern continues for Baltimore and Miami. Meanwhile, the opposite is true out West, where the absolute numbers favor heterosexual single women. San Diego has more than 50,000 more single men than women; Seattle has 46,000 more; San Jose has 37,000 more; Phoenix 32,000 more. The pattern is similar for Denver and San Francisco.
Overall, more than 60 percent of metros (234 metros) lean male, and about a third (136) lean female. There are a dozen metros where the odds are more or less even.
Among large metros (with more than one million people), tech-driven San Jose has the smallest ratio of single women to men (868 per 1,000). But across all metros, the geography is more varied. Jacksonville, North Carolina; Hanford-Corcoran, California; The Villages, Florida (a retirement community); and the Watertown-Fort Drum, New York all have ratios of 500-600 single women to 1,000 single men.
The map for singles aged 45 to 64 shows the odds shifting sharply, simply because women tend to outlive men. The map is almost entirely orange: By this age, single men have the advantage in most metros across the country.
Of course, this analysis does not account for factors that often influence our mating life. We don’t know the sexual orientation of these singles—a huge factor—nor does our analysis account for education, race, or ethnicity; or those people who are in relationships but not yet married.
Now put your hands up!
I had these lined up to read at lunchtime:
Meanwhile, for only the second time in four weeks, we can see sun outside the office windows:

Writing for CityLab, Manhattan Institute for Policy Research fellow Aaron Renn warns cities against falling into the "branding trap:"
Here’s a transit-focused video Atlanta made as part of its Amazon HQ2 bid, meant to convey that the city is home to “innovation” and is “business friendly.” It likewise showcases buses and subways as its means of ground transportation, even though only about 10 percent of the city’s commuters use public transportation, and ridership has been fading in recent years. Atlanta is a quintessential car city. There’s not much in here that links to what most people would think of when “Atlanta” comes to mind, except its airport. It’s curious that they tapped more into stereotypes of Seattle and its frequent rains than they did those of their own town.
Atlanta and Houston are major cities with strong identities. They are much more than a collection of generic urban elements. Why cities with great identities and heritages of their own so seldom lead with them is something of a mystery. If you want to see great marketing videos of cities, you almost are forced to look at what private companies are doing. Look, for example, at the famous “Imported from Detroit” Chrysler Super Bowl ad with Eminem from 2011, which managed to honestly portray the decay and struggles of the city, while playing up the resolve of its residents and the city’s history as a key music center. Indeed, the ad did a much better job of selling Detroit than Chryslers.
The problem with the typical approach extends beyond just marketing. It has tangible consequences. A brand is really a city’s conception of itself. By selling itself as a facsimile of something its not, a city ends up turning that into reality. Thus, so many urban places today seem vaguely the same—a blur of Edison-bulbed eateries and mid-rise “one plus five” apartment buildings (in which up to five stories of wood frame construction are built atop a concrete first floor). These buildings, which all look vaguely the same with their multi-shaded exterior panels that seem destined to date quickly, are now obligatory elements in densifying urban neighborhoods, as critics have observed,
In a much-discussed New York magazine essay, Oriana Schwindt dubbed this “the unbearable sameness of cities.” Traveling to the city nearest the geographic center of each state, she described how she constantly kept seeing the same Ikea lights in coffee shops she’d visit. “And it wasn’t just the coffee shops—bars, restaurants, even the architecture of all the new housing going up in these cities looked and felt eerily familiar."
It's possible that Atlanta and Houston are simply as boring as their branding suggests. I've been to both; that's my hypothesis. So maybe this is less a dire affliction of some city branding efforts and more truth-in-advertising?
I'm under the weather today, which has helped me catch up on all these stories that I haven't gotten to yet:
And now, I will nap.
At least by one metric, O'Hare has pipped Atlanta and gotten back to the top of the league table for total annual aviation operations:
O’Hare saw 903,747 flights in 2018, up 4.2 percent compared with the previous year, while Atlanta hosted 895,502 flights, up 1.8 percent, the FAA said. Los Angeles, Dallas/Fort Worth and Denver were in third, fourth and fifth place, respectively.
O’Hare also handled more than 83.4 million passengers last year, a 4.5 percent increase over 2017, according to the Chicago Department of Aviation. Both O’Hare and Midway Airport together saw more than 105 million passengers, a new record, the city said.
Hartsfield-Jackson Atlanta International Airport is still No. 1 in terms of passenger volume, and has held the crown of world’s busiest airport by that measure for 20 years. But a travel industry analyst said the new numbers are “excellent news” for Chicago, which is embarking on an $8.5 billion O’Hare modernization.
The article implies to big factors in the statistic: first, O'Hare now has six parallel runways instead of six intersecting ones, meaning traffic can flow much more easily. But second, American and United rely more on smaller, sub-50-seat airplanes than Delta does, which means more operations but fewer enplanements. So, it's a mixed bag, good for Chicago in some ways but not great for travelers at O'Hare.
Oh, I love these stories. On today's Daily WTF, editor Remy Porter describes the world I grew up in, where dates were dates and 30 December 1899 ruled them all:
If you wanted to set a landmark, you could pick any date, but a nice round number seems reasonable. Let's say, for example, January 1st, 1900. From there, it's easy to just add and subtract numbers of days to produce new dates. Oh, but you do have to think about leap years. Leap years are more complicated- a year is a leap year if it's divisible by four, but not if it's divisible by 100, unless it's also divisible by 400. That's a lot of math to do if you're trying to fit a thousand rows in a spreadsheet on a computer with less horsepower than your average 2019 thermostat.
So you cheat. Checking if a number is divisible by four doesn't require a modulus operation—you can check that with a bitmask, which is super fast. Unfortunately, it means your code is wrong, because you think 1900 is a leap year. Now all your dates after February 28th are off-by-one. Then again, you're the one counting. Speaking of being the one counting, while arrays might start at zero, normal humans start counting at one, so January 1st should be 1, which makes December 31st, 1899 your "zero" date.
Our macro language is off-by-one for the first few months of 1900, but that discrepancy is acceptable, and no one at Microsoft, including Bill Gates who signed off on it, cares.
The Basic-derived macro language is successful enough inside of Excel that it grows up to be Visual Basic. It is "the" Microsoft language, and when they start extending it with features like COM for handling library linking and cross-process communication, it lays the model. Which means when they're figuring out how to do dates in COM… they use the Visual Basic date model. And COM was the whole banana, as far as Windows was concerned- everything on Windows touched COM or its successors in some fashion. It wasn't until .NET that the rule of December 30th, 1899 was finally broken, but it still crops up in Office products and SQL Server from time to time.
The .NET epoch began 1 January 2000. Except for DateTimeOffset values, whose epoch began on the non-existent date 1 January 0. Or DateTime values (now deprecated) which start at the beginning of the Gregorian calendar in 1753. (Same with SQL Server datetime types.)
The bottom line: dates are hard.
Writing for Medium, Scott Lucas paints a dismal picture of Tinseltown after 50 more years of climate change:
“With the exception of the highest elevations and a narrow swath very near the coast, where the increases are confined to a few days, land locations see 60–90 additional extremely hot days per year by the end of century,” one study concluded. Downtown Los Angeles could experience up to 54 days measuring 95 degrees or higher by 2100, a ninefold jump. By then, temperatures in Riverside could reach over 95 degrees for half the year.
“By the end of century,” the authors of the study found, “a distinctly new regional climate state emerges.” This climate includes a new, fifth season: a super summer, driving people indoors for weeks at a time, stressing the power grid with heavy demand for air conditioning, and wreaking havoc on agriculture and, by extension, the food supply.
Meanwhile, beaches in Los Angeles will be facing their own threats. Rising sea levels will attack the coast in at least two ways: inundating beaches and eroding cliffs. “Our beaches are compromised. Not just from overall sea level rise, but also coastal storm events,” says Lauren O’Connor Faber, the city’s chief sustainability officer.
In 2017, scientists modeled the effects of sea level rise on 500 kilometers of shoreline in Southern California. A sea level rise of 0.93 to two meters, they predicted, would result in the loss of 31 to 67 percent of beaches in Southern California, including some of its most well-known. A separate USC study concluded, “In Malibu, both low and high sea level rise scenarios suggest that long segments of beach will essentially disappear by 2030.”
So this could be a thing of the past during my lifetime: