Remember Tuesday, when we were only 13 mm away from having the wettest July in history? Thanks to a storm that dumped a squishy 259 mm of rain on nearby Dubuque, Iowa, Chicago's rainfall this month reached 248 mm, beating the old record of 243 mm set in 1889.
Today's forecast calls for even bloody more rain:
Showers and thunderstorms likely. Mostly cloudy, with a high near 32°C. Heat index values as high as 37°C. Southwest wind between 10 and 15 km/h. Chance of precipitation is 70%. New rainfall amounts between 5 and 7.5 mm possible.
At 7am, the temperature of 23°C comes with a dewpoint temperature of 22°C, which is the scientific way of saying it's warm and sticky.
Let's see...warmer summers, more extreme weather, much more moisture in the atmosphere...saw that one coming.
Chicago is still experiencing weather more suited for the jungles of Cambodia:
For a 12th consecutive day Wednesday, Chicago's lows have registered 22°C or higher—the first time that's happened in 12 years and only the fourth time such a long string of warm nighttime lows has been observed at Midway Airport since 1928.
And it's still raining: another 111 mm fell on parts of the area this morning.
A weekend in Canada starts to look very appealing...
Chicago this year has not only gotten almost enough rain to hit a new record, but it's also gotten more than enough heat:
July's 230 mm of rain at O'Hare places the month only 13 mm away from July's 122 year old record of 243 mm recorded in 1889. A more typical July would have a rainfall tally closer to 67 mm by now—just a third as much as has fallen this month. ...
July's opening 26 days are averaging 26.2°C. That makes the month the warmest at O'Hare since weather readings were first archived at the site beginning in 1959. The 26.2°C average ranks as the 4th warmest July 1-26's over the full term of Chicago weather records spanning 141 years and taken at 12 different sites in the city since 1871.
Hot and wet: my favorite. (There's a joke in there somewhere...) When is October?
Welcome to the semi-annual update of the
Chicago sunrise chart. (You can get one for your own location at
http://www.wx-now.com/Sunrise/SunriseChart.aspx.)
|
Date
|
Significance
|
Sunrise
|
Sunset
|
Daylight
|
|
2011
|
|
3 Jul
|
8:30pm sunset
|
05:20
|
20:30
|
15:09
|
|
17 Jul
|
5:30am sunrise
|
05:30
|
20:24
|
14:53
|
|
9 Aug
|
8pm sunset
|
05:53
|
20:00
|
14:06
|
|
17 Aug
|
6am sunrise
|
06:00
|
19:48
|
13:48
|
|
29 Aug
|
7:30pm sunset
|
06:13
|
19:30
|
13:16
|
|
15 Sep
|
6:30am sunrise
|
06:30
|
19:01
|
12:30
|
|
16 Sep
|
7pm sunset
|
06:32
|
18:59
|
12:27
|
|
23 Sep
|
Equinox,
03:05 CDT
|
06:39
|
18:49
|
12:10
|
|
26 Sep
|
12-hour day
|
06:42
|
18:42
|
12:00
|
|
3 Oct
|
6:30pm sunset
|
06:50
|
18:30
|
11:39
|
|
13 Oct
|
7am sunrise
|
07:01
|
18:13
|
11:12
|
|
22 Oct
|
6pm sunset
|
07:11
|
17:59
|
10:48
|
|
5 Nov
|
Latest sunrise until 5 Nov 2016
Latest sunset until Feb 29th
|
07:28
|
17:40
|
10:12
|
|
6 Nov
|
Standard time returns
6:30am sunrise
Earliest sunrise until Feb 28th
|
06:29
|
16:39
|
10:10
|
|
16 Nov
|
4:30pm sunset
|
06:41
|
16:30
|
9:47
|
|
2 Dec
|
7am sunrise
|
07:00
|
16:21
|
9:20
|
|
8 Dec
|
Earliest sunset of the year
|
07:06
|
16:20
|
9:14
|
|
21 Dec
|
Solstice,
23:30 CST
|
07:15
|
16:23
|
9:08
|
|
2012
|
|
3 Jan
|
Latest sunrise until Nov. 14th
|
07:19
|
16:32
|
9:13
|
|
28 Jan
|
5pm sunset
|
07:07
|
17:00
|
9:52
|
|
5 Feb
|
7am sunrise
|
07:00
|
17:11
|
10:10
|
|
21 Feb
|
5:30pm sunset
|
06:39
|
17:31
|
10:52
|
|
27 Feb
|
6:30am sunrise
|
06:30
|
17:38
|
11:08
|
|
10 Mar
|
Earliest sunrise until Apr. 15th
Earliest sunset until Oct. 27th
|
06:10
|
17:52
|
11:42
|
|
11 Mar
|
Daylight savings time begins
Latest sunrise until Oct. 21st
Earliest sunset until Sept. 20th
|
07:09
|
18:53
|
11:45
|
|
16 Mar
|
7am sunrise, 7pm sunset
12-hour day
|
07:00
|
18:59
|
11:59
|
|
20 Mar
|
Equinox
00:14 CDT
|
06:53
|
19:04
|
12:10
|
|
3 Apr
|
6:30am sunrise (again)
|
06:29
|
19:19
|
12:50
|
|
13 Apr
|
7:30pm sunset
|
06:13
|
19:30
|
13:17
|
|
21 Apr
|
6am sunrise
|
06:00
|
19:39
|
13:39
|
|
10 May
|
8pm sunset
|
05:35
|
20:00
|
14:24
|
|
15 May
|
5:30am sunrise
|
05:30
|
20:05
|
14:35
|
|
14 Jun
|
Earliest sunrise of the year
|
05:15
|
20:28
|
15:13
|
|
20 Jun
|
Solstice
18:09 CDT
8:30pm sunset
|
05:16
|
20:30
|
15:14
|
|
26 Jun
|
Latest sunset of the year
|
05:17
|
20:31
|
15:13
|
You can get sunrise information
for your location at wx-now.com.
...to go somewhere else. Yesterday's final, official figure: 208 mm, a full 43 mm more than the rainfall that caused the record floods in August 1987.
And it's not over yet.
Today has set the record as the wettest day in Chicago history, and (a) it's only 11am and (b) more rain is coming:
Overnight rains that approached 178 mm over northern Cook County broke several impressive Chicago records. 176 mm of precipitation has been measured at O'Hare International Airport since Midnight making today, Chicago's wettest calandar day in modern weather history.
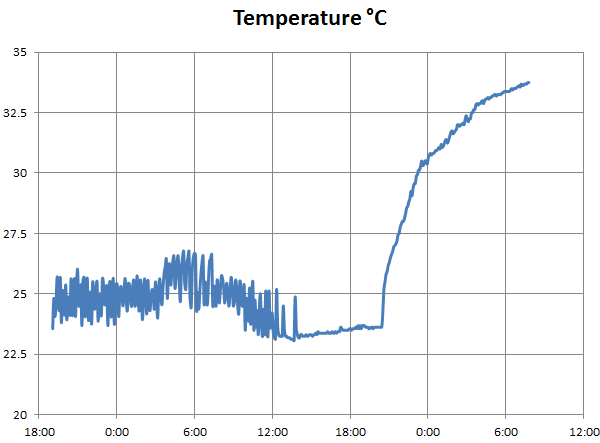
What happens when two air conditioners together draw more than 15 amps on a 15-amp circuit? This:
(Click to see full-size.)
The graph not only shows how quickly the place warmed up when the breaker tripped Wednesday evening, but also how slowly it cooled off once I closed the breaker. The initial cliff-like dive in temperature yesterday at 5:15pm happened because after turning the AC back on, I put a box fan next to the server rack and shut down two of the servers. You can see the temperature bumped up a degree when I turned them back on around 11:15pm.
So far today the servers are staying within their safe zone, under 27.5°C. The massive thunderstorms that just pushed through, which have kept the outside temperature under
24°C so far today, has helped. Tomorrow, however, the forecast calls for
34°C again.
How long until October?
It appears the air conditioners back at IDTWHQ have failed, while I'm 1,700 km away:
The chart starts at 7pm Chicago time Tuesday. The squiggle shows the backup air conditioner cycling on and off while it's in "energy saving" mode. That stops around 2pm yesterday, when, I imagine, the backup failed. Then, at 8:30pm last night, the main seems to have stopped.
I'll be leaving San Antonio on an earlier flight. I just hope the A/C units have simply stopped, and that they'll start again when I turn them on. Chicago's forecast calls for a high of 34°C today only going down to 24°C overnight. But without cooling, Inner Drive's poor servers may not last another two hours...
Chicago has seen its hottest temperatures in years this week, with more coming today:
Not since July 24, 2005 when O'Hare hit 39°C and a reading of 40°C occurred at Midway, has a triple-digit [Fahrenheit] reading occurred at the city's two observation sites. The entire 83 year observational record at Midway includes only 84 38°C or higher temperatures—and just 26 have occurred in the nearly half-century period since 1960.
Good thing I'm not in Chicago this week. No, I'm in San Antonio, where the temperature has stayed a cool and delightful 37°C. Every day. Except yesterday, when it rained for half an hour.
I fully expect this business trip to balance out in January when I get sent to Manitoba.
The National Oceanic and Atmospheric Administration released the 1981-2010 temperature normals this week, and guess what? They're warmer:
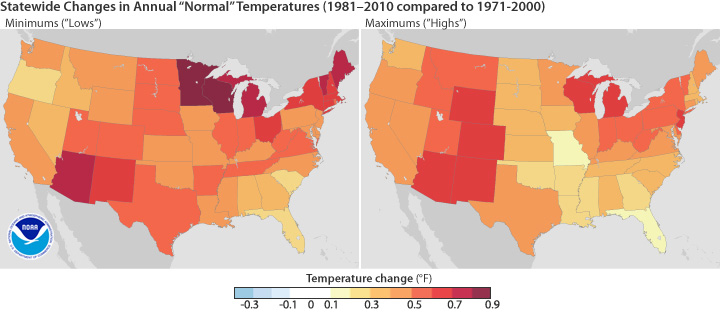
Normals serve as a 30 year baseline average of important climate variables that are used to understand average climate conditions at any location and serve as a consistent point of reference. The new normals update the 30-year averages of climatological variables, including average temperature and precipitation for more than 7,500 locations across the United States. This once-a-decade update will replace the current 1971–2000 normals.
In the continental United States, every state’s annual maximum and minimum temperature increased on average. “The climate of the 2000s is about 1.5 degree F warmer than the 1970s, so we would expect the updated 30-year normals to be warmer,” said Thomas R. Karl, L.H.D., NCDC director.
Like the myth of heliocentrism before it, the myth of anthropogenic climate change will stand forever disproven!
(Yet, it moves...)