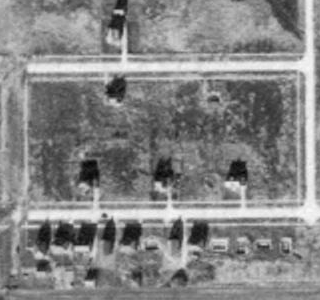
The University of Illinois has a stash of aerial photographs of Illinois from 1938 and 1939, including one that shows the house I grew up in under construction. The photo at left is 1938; at right is 2001:

Here's a larger crop of the 1938 photo overlaid with a 2010 image:
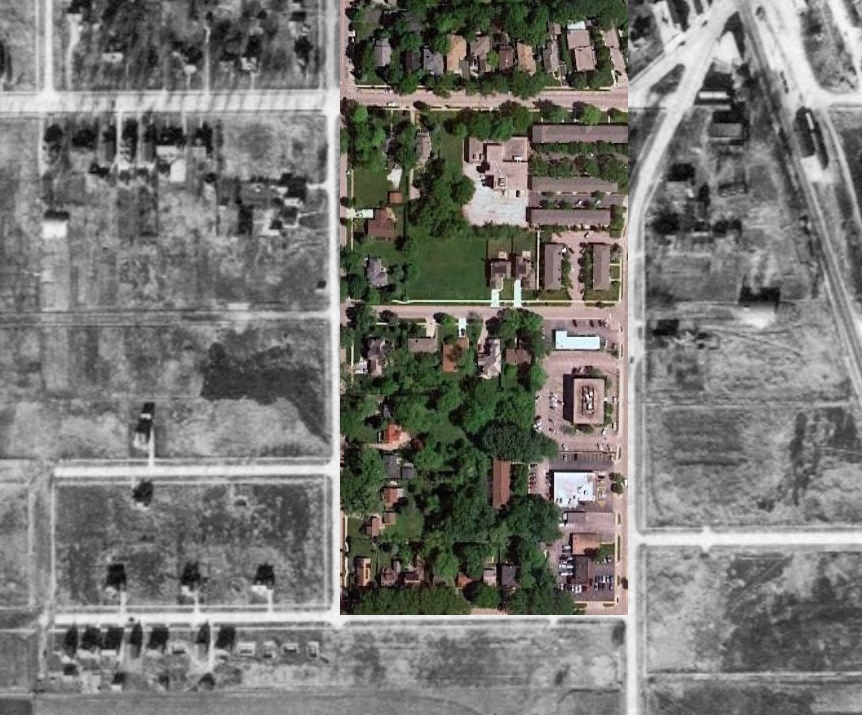
Natives of the town will probably recognize it instantly.
Here's an extreme close-up with the foundation of my house highlighted:

I also looked at photos of Chicago from the same batch, and after posting this, I will look for more recent photos. The construction of the city's expressways started in the 1940s; I'm curious to see "during" photos.
NPR put listener comments about the State of the Union address through a word-cloud generator and came up with this:

They explain:
Why is "salmon" so big? As The Two-Way explains, NPR's Facebook followers were referring to one of the night's humorous moments — when the president joked about the complicated and convoluted way the government regulates salmon.
"The Interior Department is in charge of salmon while they're in fresh water, but the Commerce Department handles them when they're in saltwater," Obama said. "I hear it gets even more complicated once they're smoked." That last line drew big laughs from lawmakers in the Capitol.
Mmmm. Smoked salmon. Inspiring.
No, I'm not making a dig about the Republican Party. Wired has a story this month about the quiet increase in AI happening all around us:
Today's AI bears little resemblance to its initial conception. The field’s trailblazers in the 1950s and '60s believed success lay in mimicking the logic-based reasoning that human brains were thought to use. In 1957, the AI crowd confidently predicted that machines would soon be able to replicate all kinds of human mental achievements. But that turned out to be wildly unachievable, in part because we still don’t really understand how the brain works, much less how to re-create it.
So during the '80s, graduate students began to focus on the kinds of skills for which computers were well-suited and found they could build something like intelligence from groups of systems that operated according to their own kind of reasoning. "The big surprise is that intelligence isn't a unitary thing," says Danny Hillis, who cofounded Thinking Machines, a company that made massively parallel supercomputers. "What we've learned is that it's all kinds of different behaviors."
We're a long way from ELIZA, except in the field of software project management. (Little joke there.)
I've just pushed out an interim build of the Inner Drive Technology demonstration project, Weather Now. In addition to fixing a couple of annoying bugs, I added a significant new feature. The weather lists on the home page now can show whatever text I want for the weather station names. Before, it could only show their official designations, which made the lists harder to use.
You can see how useful this is immediately. The list of NFL football games now shows you what game the weather goes with. Also, I added arbitrary sort ordering and station begin/end times, so the lists you see today may not be the same as the lists you see tomorrow.
These features take the site a half-step closer to the next major release, due at the end of January, that will allow you—yes, you—to set up your own lists. That feature set will take a while to develop, which explains why I wanted to get this half-point release out first.
Strange Maps finds our state mottoes through Google:
Google any word, and the search engine will suggest a longer phrase, based on the popularity of current searches starting with the same word.
This so-called autocomplete function (1) is, like any good advice, in equal parts helpful and annoying. Also, being a clever piece of statistics, it offers a fascinating insight into the mind(s) of the Great Online Public.
The same principle of random revelation can be applied to geographic terms, which is exactly what this map does. These United States of Autocomplete have been collated simply by typing in the name of each US state, then plotting the autocompleted results on an actual map of the US.
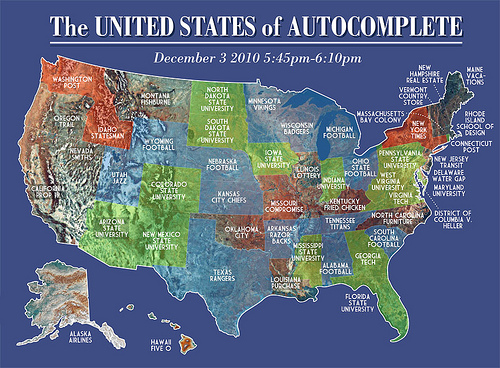
Montana's, and Washington's are, for different reasons, the most surprising.
The first official 2010 Census results are out today. As of April 1st there were 308,745,538 residents of the United States. California, the most populous, had 37,253,956; Wyoming, the least, had 563,626.
We have a decennial census in the U.S. because our Constitution mandates it. Every 10 years, we reapportion representation. This time, very much like the last time, Illinois, Missouri, Michigan, Pennsylvania, New Jersey, and Massachusetts are losing a seat; New York and Ohio are losing two; Washington, Nevada, Utah, Arizona, Georgia, and South Carolina gain one; Florida gains two; and in a sign of the Apocalypse, Texas gains four. Louisiana also lost a seat, most likely as a result of people fleeing after Katrina in 2005 (though the state did have a net gain of around 70,000 people). With these results, each member of the House represents about 711,000 people.
Oddly, only Michigan and Puerto Rico lost population since 2000. Nevada had the biggest proportional gain, its population increasing 35%. Texas had the largest numeric gain, of about 4.5 million. Other big gains include North Carolina (about 1½ m), Arizona (25%), Utah (23%), and Idaho (21%).
The Census has an interactive tool that has data back to 1910 for more information.
The New York Times has released an application mapping key Census indicators by census tract.
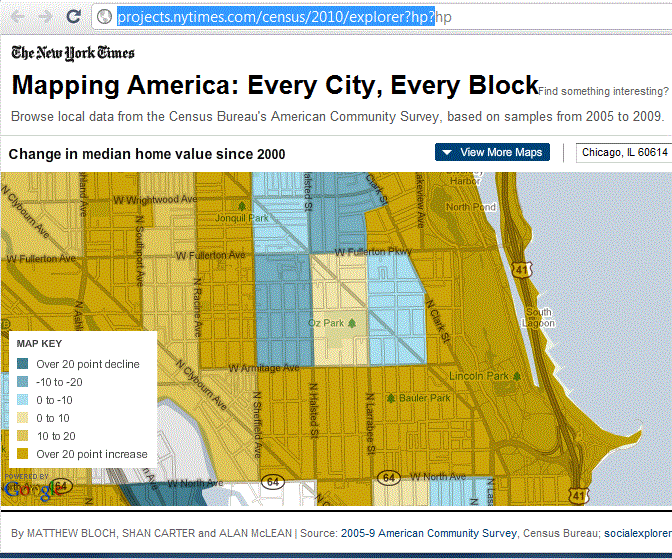
Seriously, you could spend hours playing with this thing.
I almost forgot: the Inner Drive demonstration site, Weather Now, got a significant upgrade this weekend, to version 3.6. I added two new features that are part of long-term plan of improvements. They don't sound like much, but they're pretty important bits that other features will depend on.
First, the lists of weather stations that appear on the home page are now generated dynamically from a database table. This means that I can change them, remove them, add them, or schedule them without having to make code changes. For example, during NFL Football season, you'll notice a list of home football games that changes every Tuesday at midnight Eastern time. In the past, to add a list like that, I'd have to make code and configuration changes. Now I don't.
Now the cool part, and how this is just a step towards a larger feature: In version 3.7 (coming out in January, I hope), you, dear user, will be able to create your own lists.
Second, I've added caching to the current weather reports. Before, every page view required multiple round-trips to the weather database. Now, any time the site retrieves current weather from the database, it stores the reports for some length of time. Any subsequent page requests will find the weather reports in the cache. This means the home page loads significantly (10x) faster on most views. The site gets about 11,000 page views every day, so this is non-trivial.
The cache right now has a fixed expiration time of 180 seconds, and I can change that through the standard application configuration tools. By "fixed" I mean the cache will discard all reports older than three minutes, forcing the application to refresh those reports from the database. This strikes a good balance between current data and application speed, I think, especially since the National Weather Service (whence comes the data) has new information at about that frequency. (You can read more about how caching works in the Inner Drive Extensible Architecture™ SDK.)
I think these are really cool changes, and I'm excited about how much it moves me down the roadmap. And the 3.7 update will be even cooler.
My demo site, Weather Now, has a feature showing weather extremes for the world. Northwest Canada right now is having unusually cold weather. What's the connection? The Calgary Herald published a story about the website yesterday and syndicated it across Canada. Jenna McMurray of the Calgary Sun also picked up the story, and called me for a quick interview.
As a result, Weather Now went from a daily average 4,000 page views up to a server-smashing 337,000 yesterday. It seems traffic has tapered off a bit today, but I'm still getting enormously more hits than usual.
I'm also getting a lot more feedback, like this note from Judy C., who had a Canadian IP address:
Get your facts straight. You and others in your country love to make statements based on minimum research and not double checking what you "think" is correct! Calgary: 2nd coldest place on earth is just as
stupid a comment as other comments on your home page: the world (just the US)! Good grief, no wonder the rest of world laughs at you behind your back.
It took me a few seconds to work out the "just the US" part, but apparently she referred to the link of "coldest places" that filters for just U.S.-based weather reports.
Otherwise, here follows my reply:
Judy,
Thanks for writing.
The site is a programming demo, not a commercial website. As such we only get free information from U.S. government computers. We have no control over the quality or quantity of information that foreign governments make available to the U.S. National Oceanic and Atmospheric Administration, nor do we have any control over what NOAA makes available to us.
The difficulty our site faces is that Environment Canada and similar agencies in other Commonweath nations retain Crown copyright over most of the data that we would want on our site. EC only makes data available for about 100 stations in Canada. So even though it got down to -35C in parts of Alberta Monday night, the only stations we had available in the affected region were two near Calgary, which only got to -30C. As it turns out, northern Alberta briefly got colder (-39C) than Antarctica (-38C), and was, as far as anyone knows, the coldest place on earth.
The site automatically produces the lists of hottest and coldest places every 20 mintues without human intervention. All these facts conspire to produce some odd results from time to time, particularly during severe weather events such as the one Canada is experiencing in Alberta, Saskatchewan, and the Northwest Territories right now.
As for the rest, I assure you the world laughs at us to our faces, not behind out backs. We have a reputation for being rude, thoughtless, and belligerent that other people--for example, Canadians--do not. It occasionally makes polite discourse difficult, as people sometimes assume the worst motivations on the basis of the most banal facts.
Thank you again for your note.
She thanked me for my considered reply. Aww.